By Taylor Centers | January 7, 2020
Welcome to an introduction to hardware hacking! This series will discuss the basics of interacting with an embedded device though various hardware interfaces. Our team performs penetration testing on IoT / embedded devices every day, and we’re excited to share some of our knowledge and experiences to help those getting started with hardware security learn the ropes. This is a multi-part series which discusses the fundamental concepts, useful tools, and practical techniques which you can use to approach a basic hardware assessment.
For our first blog post in this series, we will focus on a very common type of debug serial communication protocol that can be used to obtain low-level access to a wide range of devices.
A Universal Asynchronous Receiver-Transmitter (UART) is a hardware serial communication bus used by most processors and chips. This bus is typically how a user or developer can interface with the processor via a serial port. With access to the UART, a user can see bootloader and operating system logs. Sometimes a console for interacting with the device’s bootloader or OS is provided as well.
This entry in the Hardware Hacking 101 series will explain what you need to know about UART/Serial communication, and walk through the process of finding and connecting to the UART port on a router. We have chosen to work with a cheap, simple, off-the-shelf router, so anyone learning can walk through this with us.
Materials
List of materials used in the example:
UART/Serial Protocol Overview
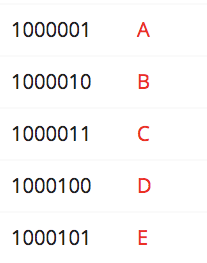
It’s easy to think of serial communication like Morse Code. In Morse Code there are only two signals that can be sent - a short beep or long beep. By combining short and long beeps in a specific order they can be understood to be letters and words.
| Morse Code | ASCII |
|---|---|

|
|
Computers use this same concept to communicate by sending 1’s and 0’s by making a wire sit at a logic high (commonly 3.3V) voltage or logic low (commonly 0V, or ground) voltage.
Usually what we will see when a device boots or from debugging output is ASCII encoded letters and words, but any digital data is just 1’s and 0’s and can be sent and received via UART.
A UART device uses separate pins for input and output, rather than sending and receiving on the same line. This lets the device receive input while it’s sending output, unlike a walkie talkie1 that can only do one at a time.
These input and output pins are referred to as RX (receive) and TX (transmit). For a more in-depth introduction into the protocol itself check out this tutorial from Sparkfun.
When two UART devices are talking to each other, the RX pin on one device should be connected to the TX pin on the other and vice versa.
Device Setup
The first thing we’ll do is disassemble the router to access the circuit board. There are two screws on the back of the device that should be removed, then the plastic enclosure can be pulled apart.
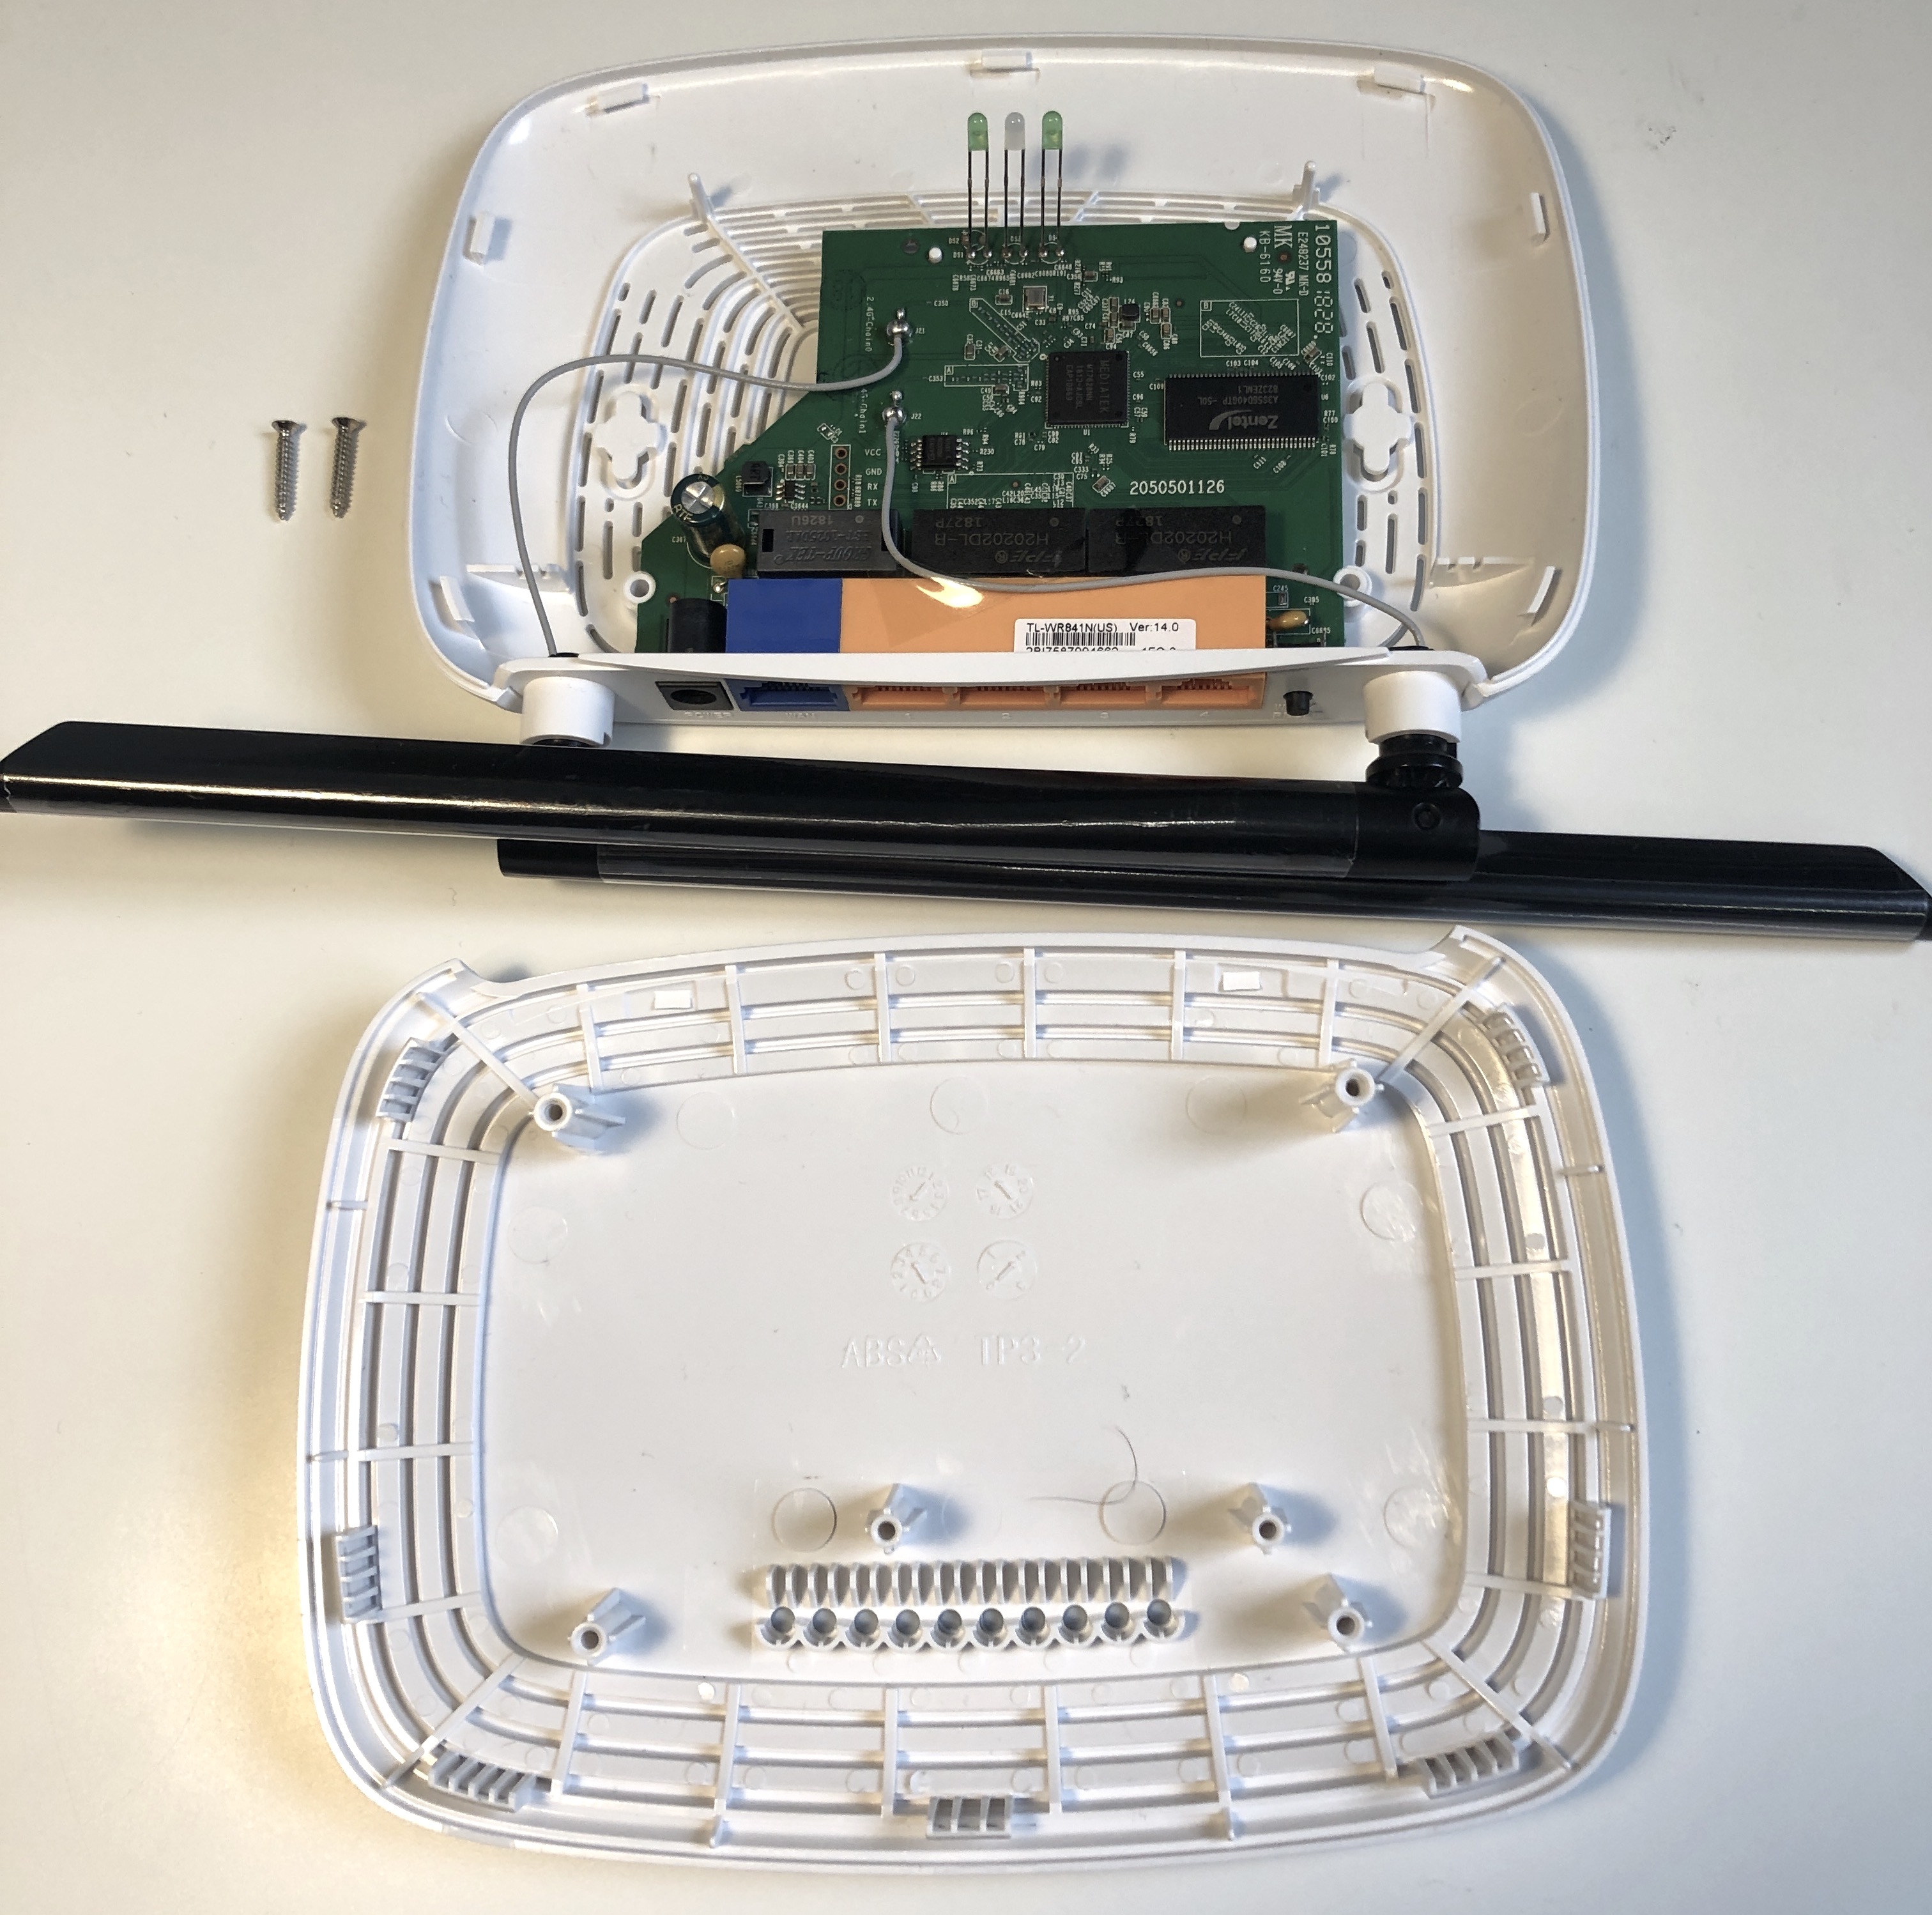
This is a very simple board with very few components and only one unpopulated header for debugging. More complicated devices will have many different components, multiple processors, CLPDs and/or FPGAs, multiple flash memories for different firmware and settings, cryptography co-processors, and various debugging ports and interfaces.
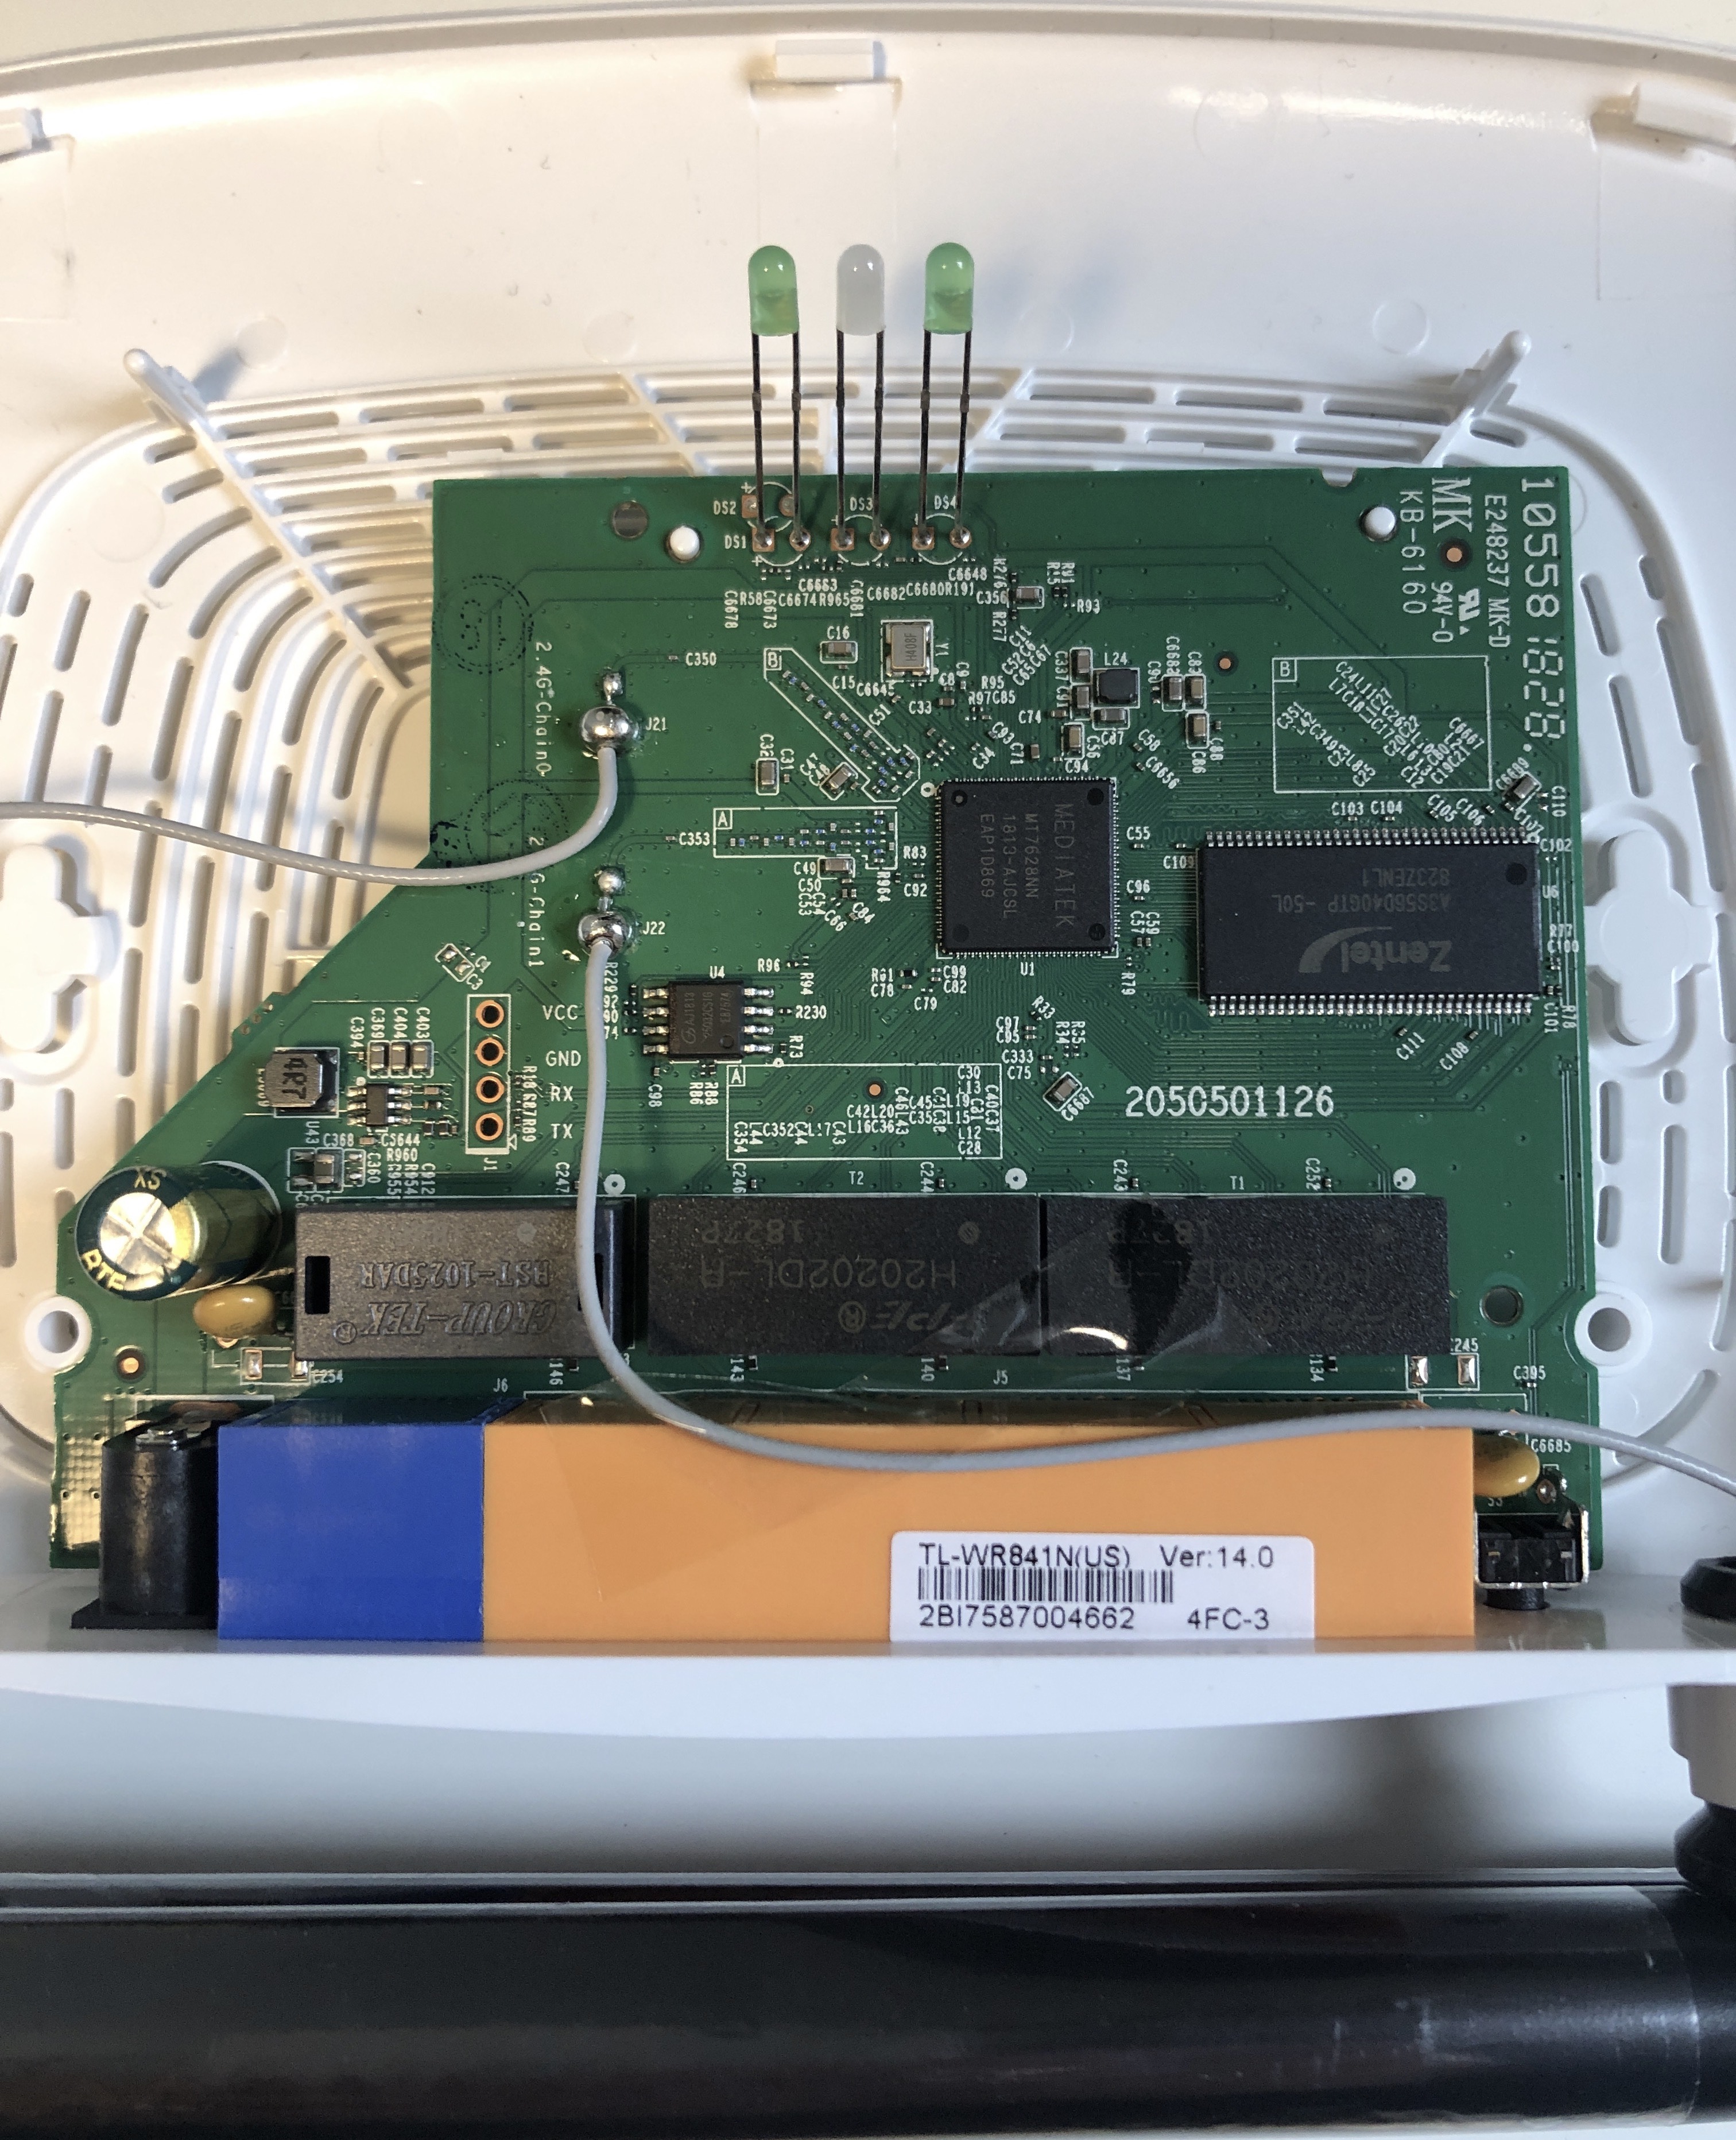
We can see that the debug header on the board is labelled. However, we’re going to proceed as if we are unaware of its pinout or functionality.
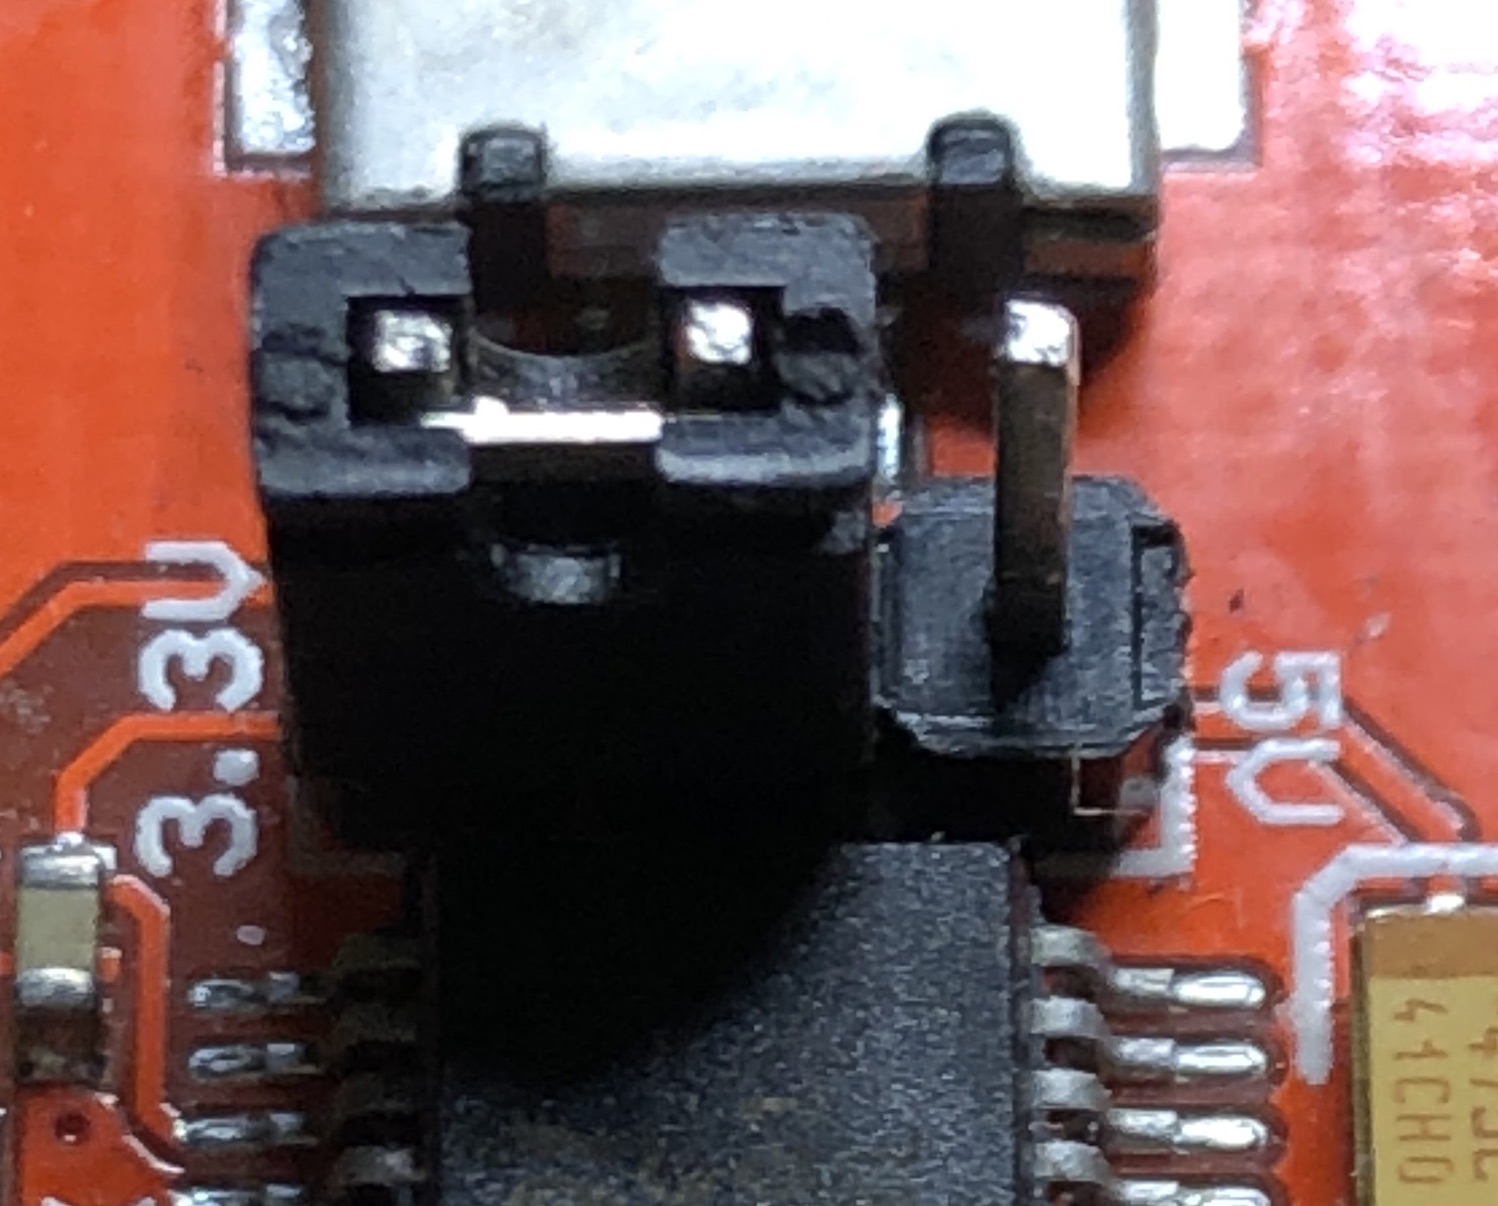
To make accessing these debugging pins easier, solder a set of header pins to the board. (soldering tutorial: https://www.youtube.com/watch?v=RKJuGR1CsAw)
Using a Logic Analyzer to Find TX
On most devices, the UART interface is exposed on debugging pins like we found here. Unfortunately, they are often not labelled and/or are hidden among dozens of other headers. To find the UART pins we will connect the pins to a logic analyzer and look for data being transmitted. In the case of this device, bootloader and kernel logs are printed to this interface on startup, so we will expect to see data come across the transmit line of the UART device.2 This is what we will be looking for.
A logic analyzer is a tool that will show us the digital signal on each pin it is connected to - whether the pin is transmitting a 1 (high voltage) or a 0 (low voltage). We are using the Saleae Logic Analyzer in this example, but a ten dollar analyzer will be able to sample the state of the pins quickly enough to see serial data go across. For more advanced applications a more robust analyzer will be needed which can sample at a much faster rate.
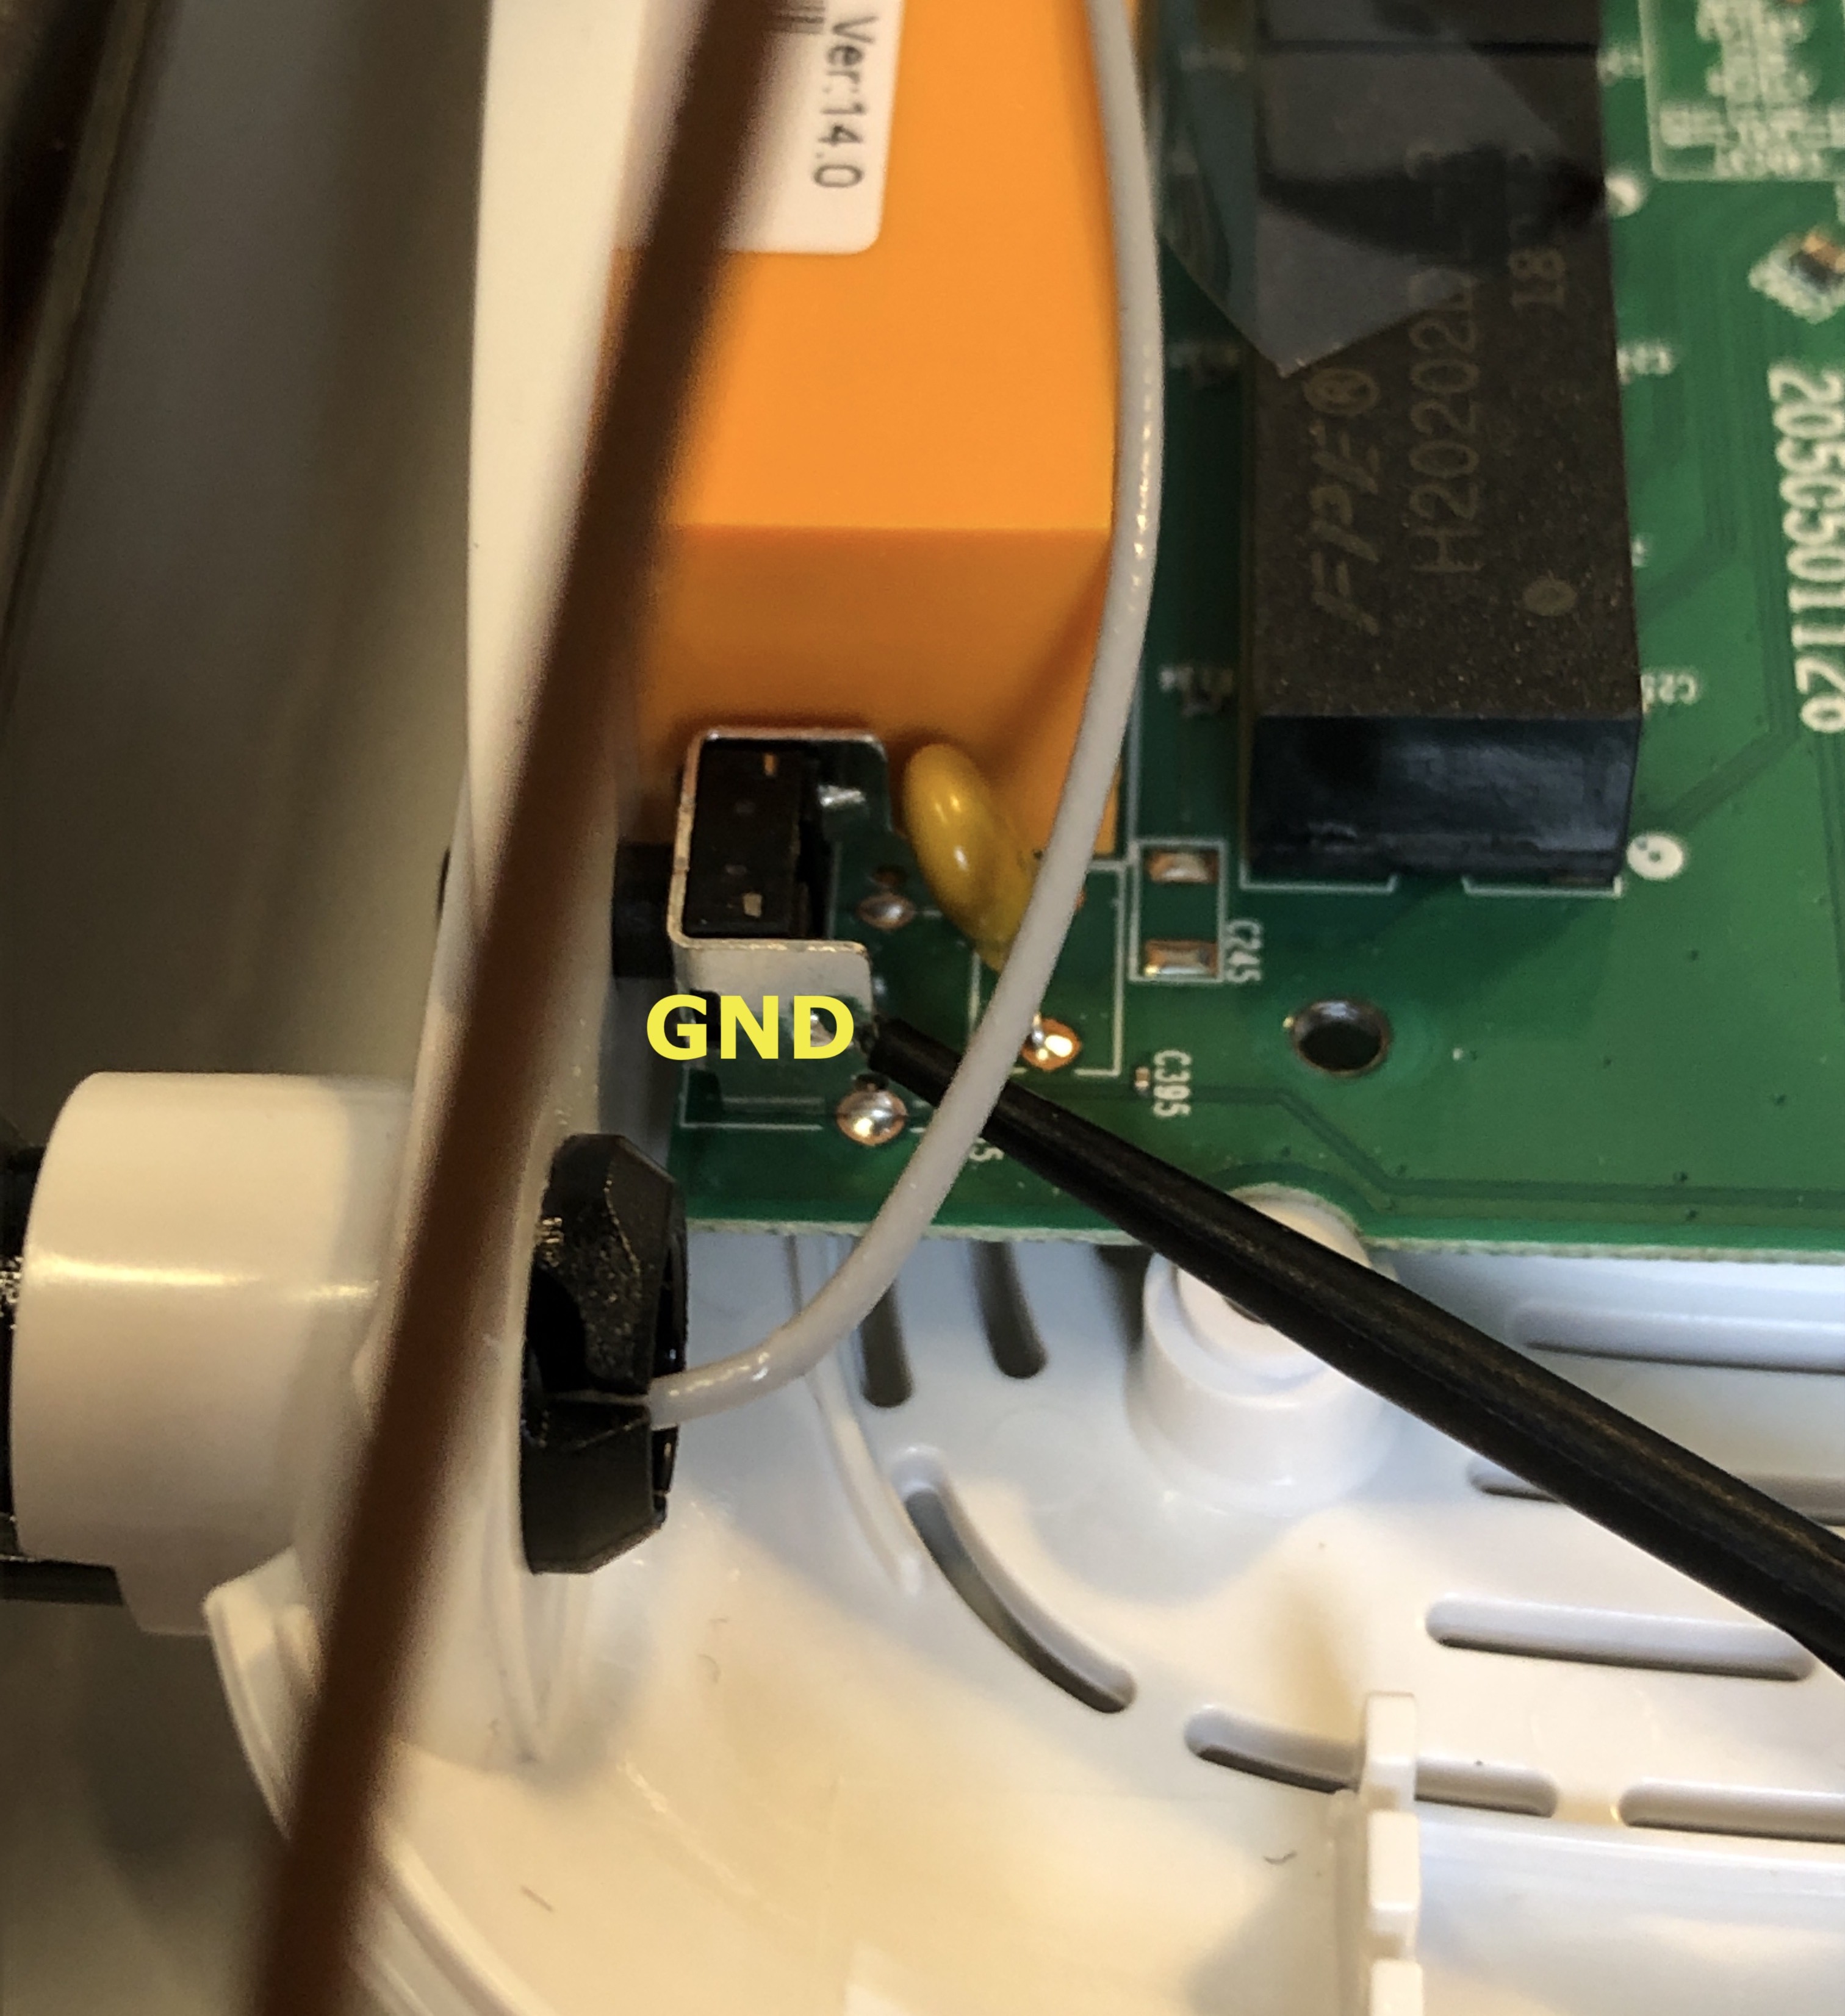
We want the logic analyzer to be able to tell us when a pin is high (1) and when it is low (0). To do this the analyzer device needs to have a reference to what the target device (our router) sees as low. A quick and easy way to do this is to connect the ground wire on the logic analyzer to any shielding on the target device as these are traditionally connected to the ground plane on nearly all PCBs.
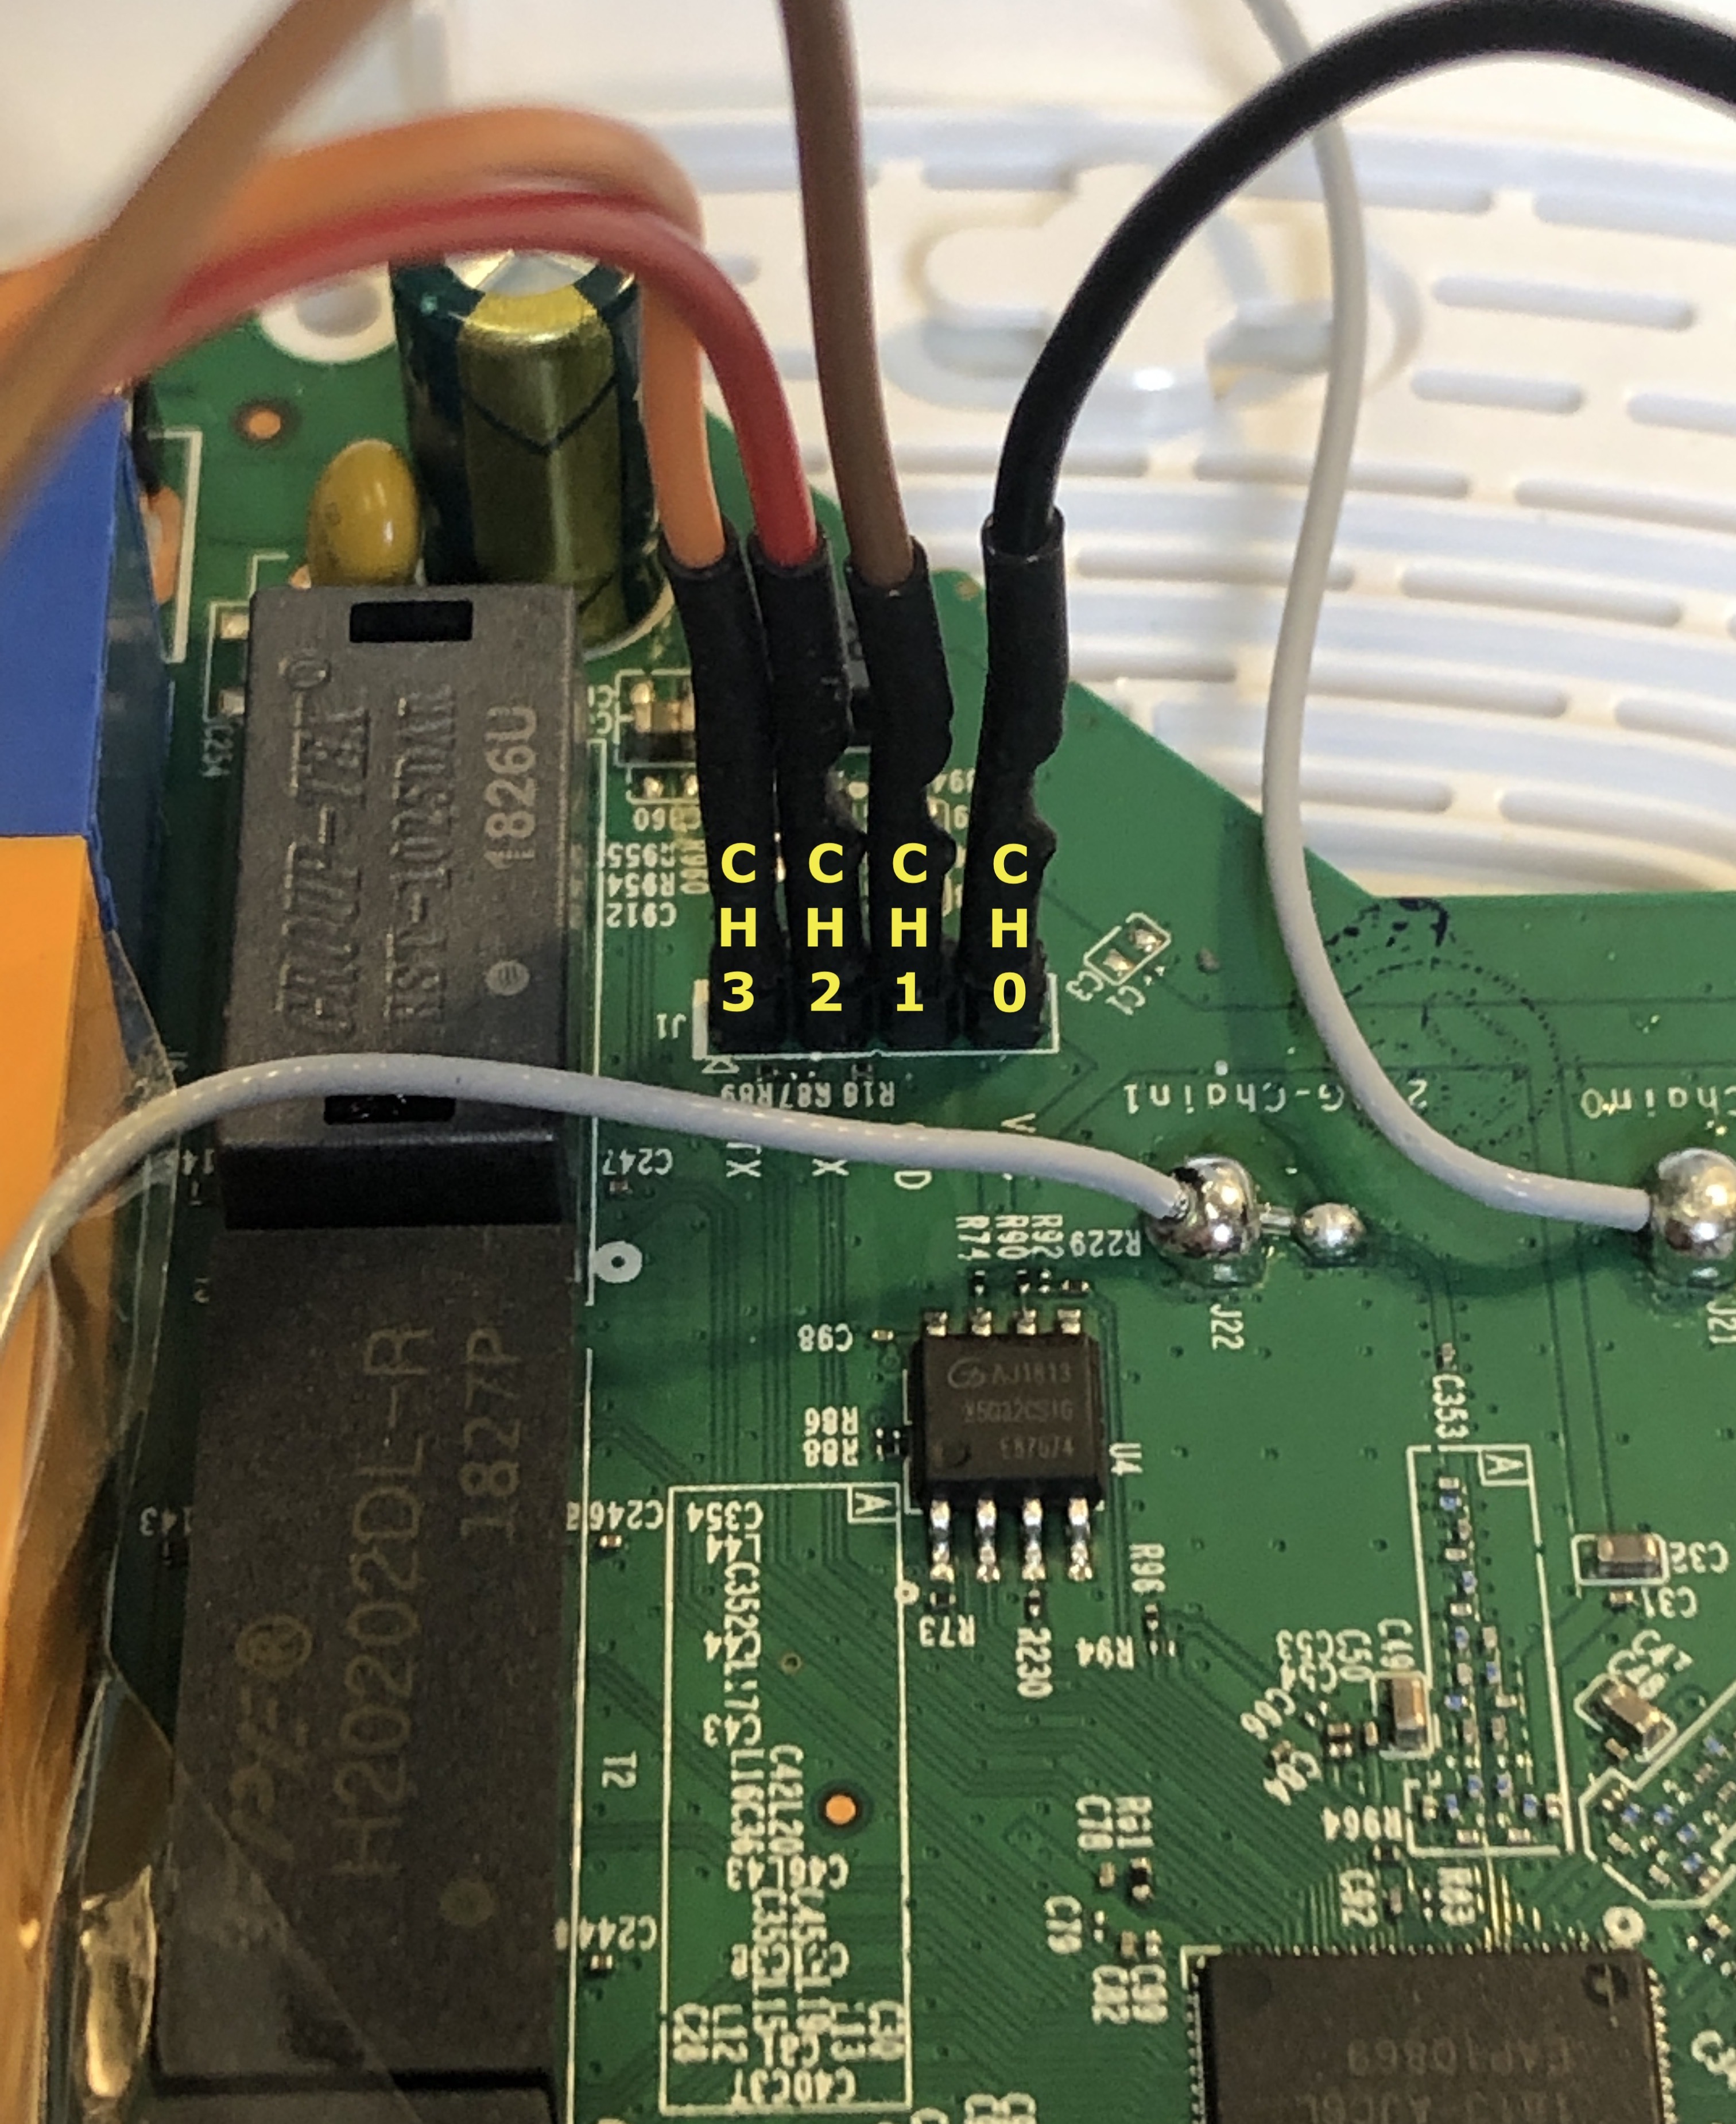
Connect the analyzer into the pins on the header, connect the analyzer to your computer, and launch the free Saleae Logic software.
We have set the capture settings for the analyzer at 8 Mega-samples per second (8MS/s) and gave ourselves 10 seconds of capture time, which will be plenty to determine which pin is transmitting the startup logs.
Once everything has been set up, begin the capture and turn on the router.
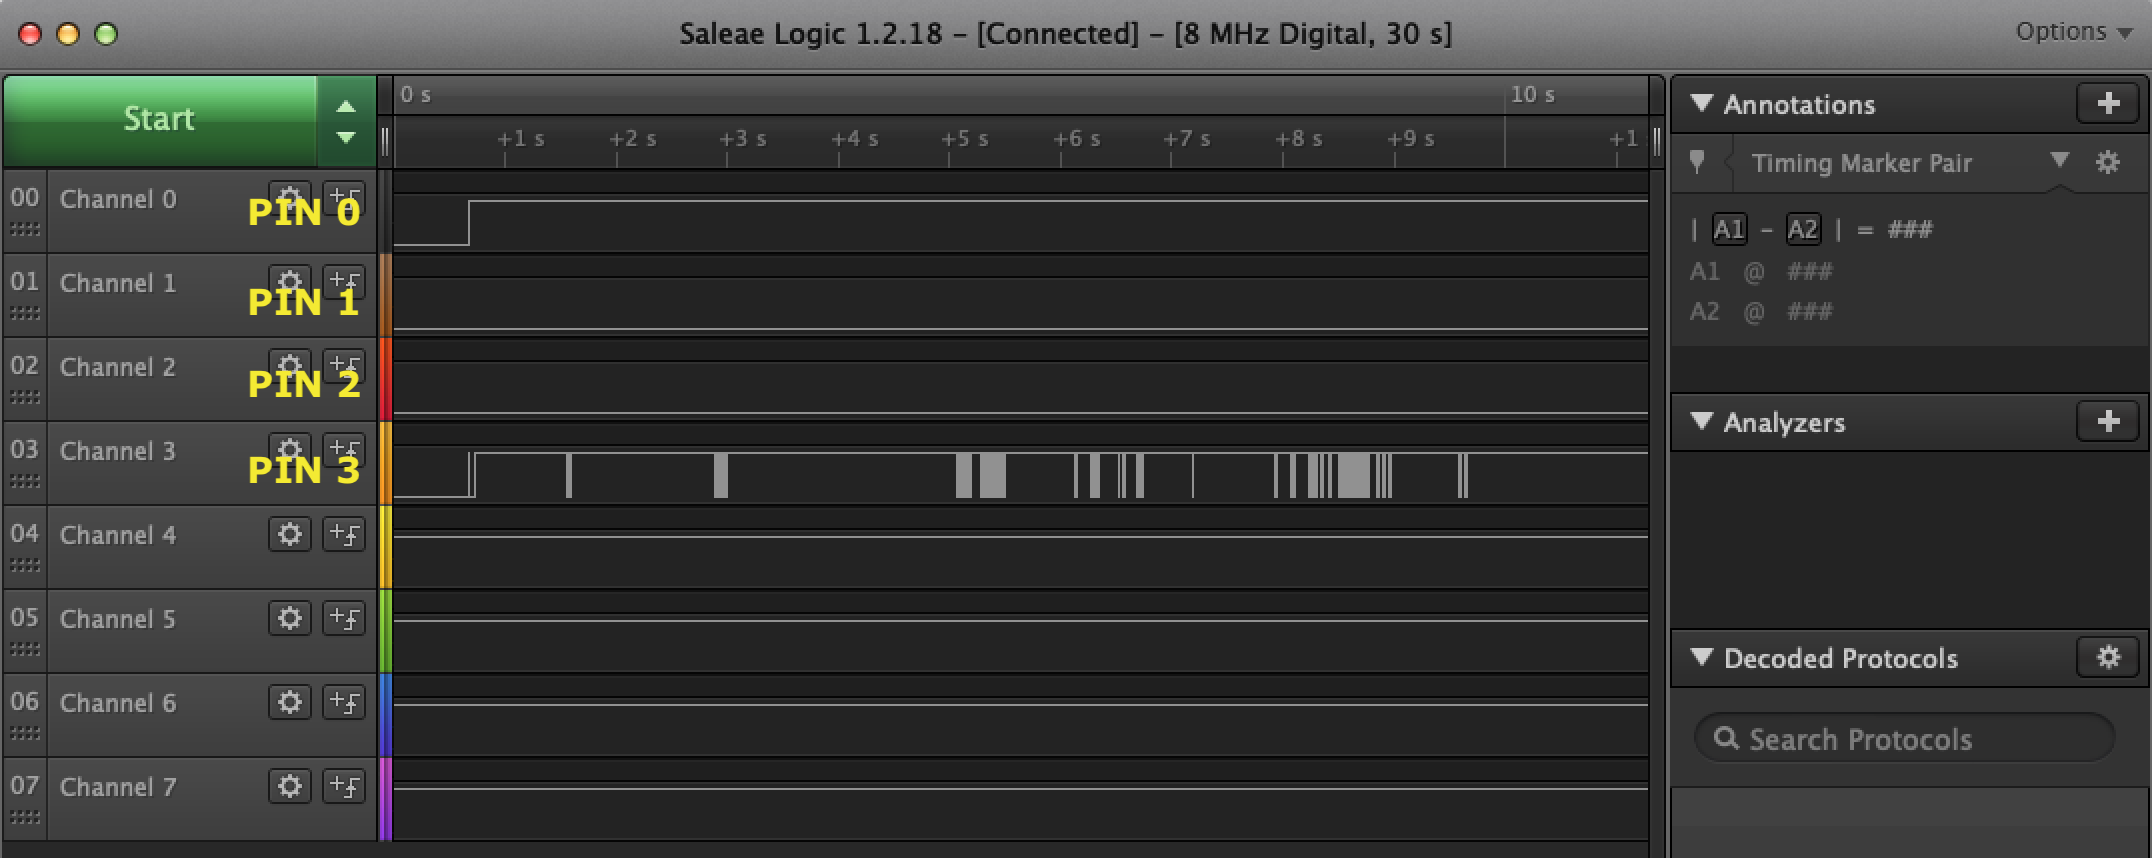
Note: Channel 0 is pulled high.
Viola! We can see data coming in on Channel 3.
The default state for channel 3 appears to be high as well, which is a good indicator that this is real data coming through, most UART devices will default high when no data is actively being sent as an indication that the line is not damaged.
Baud Rates
We now want to validate that what we are seeing is actually serial communication and to determine the baud rate so that we can interpret the data.
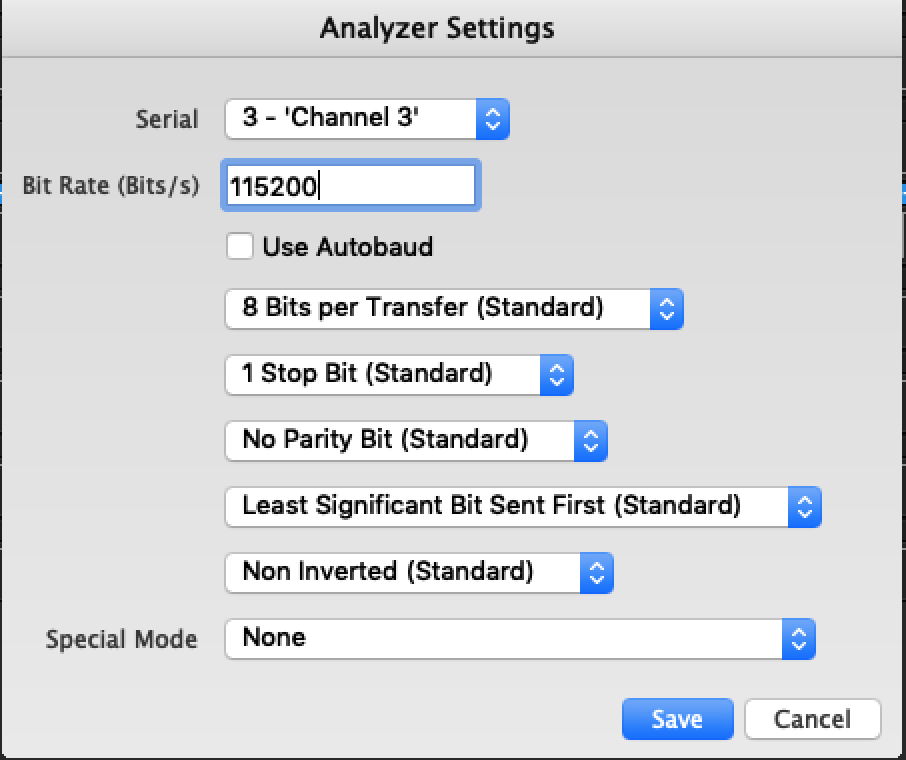
The software we are using has protocol decoders built in - called analyzers. We can add one to our channel of interest and attempt to decode the data.
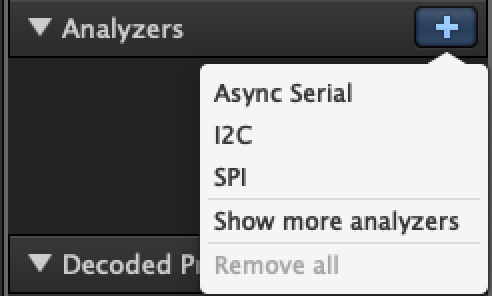
In this case, we will keep all the settings set to their “Standard” values, but will need to change the “Bit Rate” (also called a baud rate). This value needs to be the same for both the transmitting and receiving device since there is no shared clock between the two devices for synchronizing the data transmissions. This value tells the device how often it should check its receiving line (RX) of data to determine if it is high or low, and also determines how quickly it will send data on it’s transmitting line (TX).
To simplify, if one device sends 10 bits of data in 10 seconds, for example 1-0-1-0-1-0-1-0-1-0, but the device receiving the data only checks every 2 seconds, then it would only see 0-0-0-0-0.
There are many standard baud rates used for different applications (110, 300, 600, 1200, 2400, 4800, 9600, 14400, 19200, 38400, 57600, 115200, 128000 and 256000). In my experience, the most common baud rate for UART is 115200.
The Logic software will indicate errors and show the frequency of samples on top of the data that was captured, this can help guide the determination of the baud rate by attempting to line up the sample rate with the data, whether the baud rate should be higher or lower.

Once the analyzer has been added and the correct baud rate set, the decoded data will appear above the data and in the “Decoded Protocols” section of the interface.
Opening a Serial console through a FTDI
Now we will want to connect to the serial interface from our computer. To do this we need a specialized piece of hardware often called an FTDI (referring to the company which produces a common chip for this usage). This device is a USB to serial UART interface. It will convert the UART/Serial to USB and back so the two devices can communicate.
Logic Level
Similar to how we needed to find a common low (ground) for the logic analyzer, we will need to determine the voltage the target device is using for a high value. The FTDI we used has an option to either use 3.3V or 5V. If the router’s chip is using 3.3V and we send it 5V then it will overload the device, ignore our signal, and in some cases may ruin the chip. On the other hand, if the router is using 5V and we provide 3.3V, then when we try to send a high value it might not register on the device.
The specific thresholds for different chips can be found in their datasheet electrical characteristics section which will tell you the minimum and maximum voltages for a logical high value to be identified.
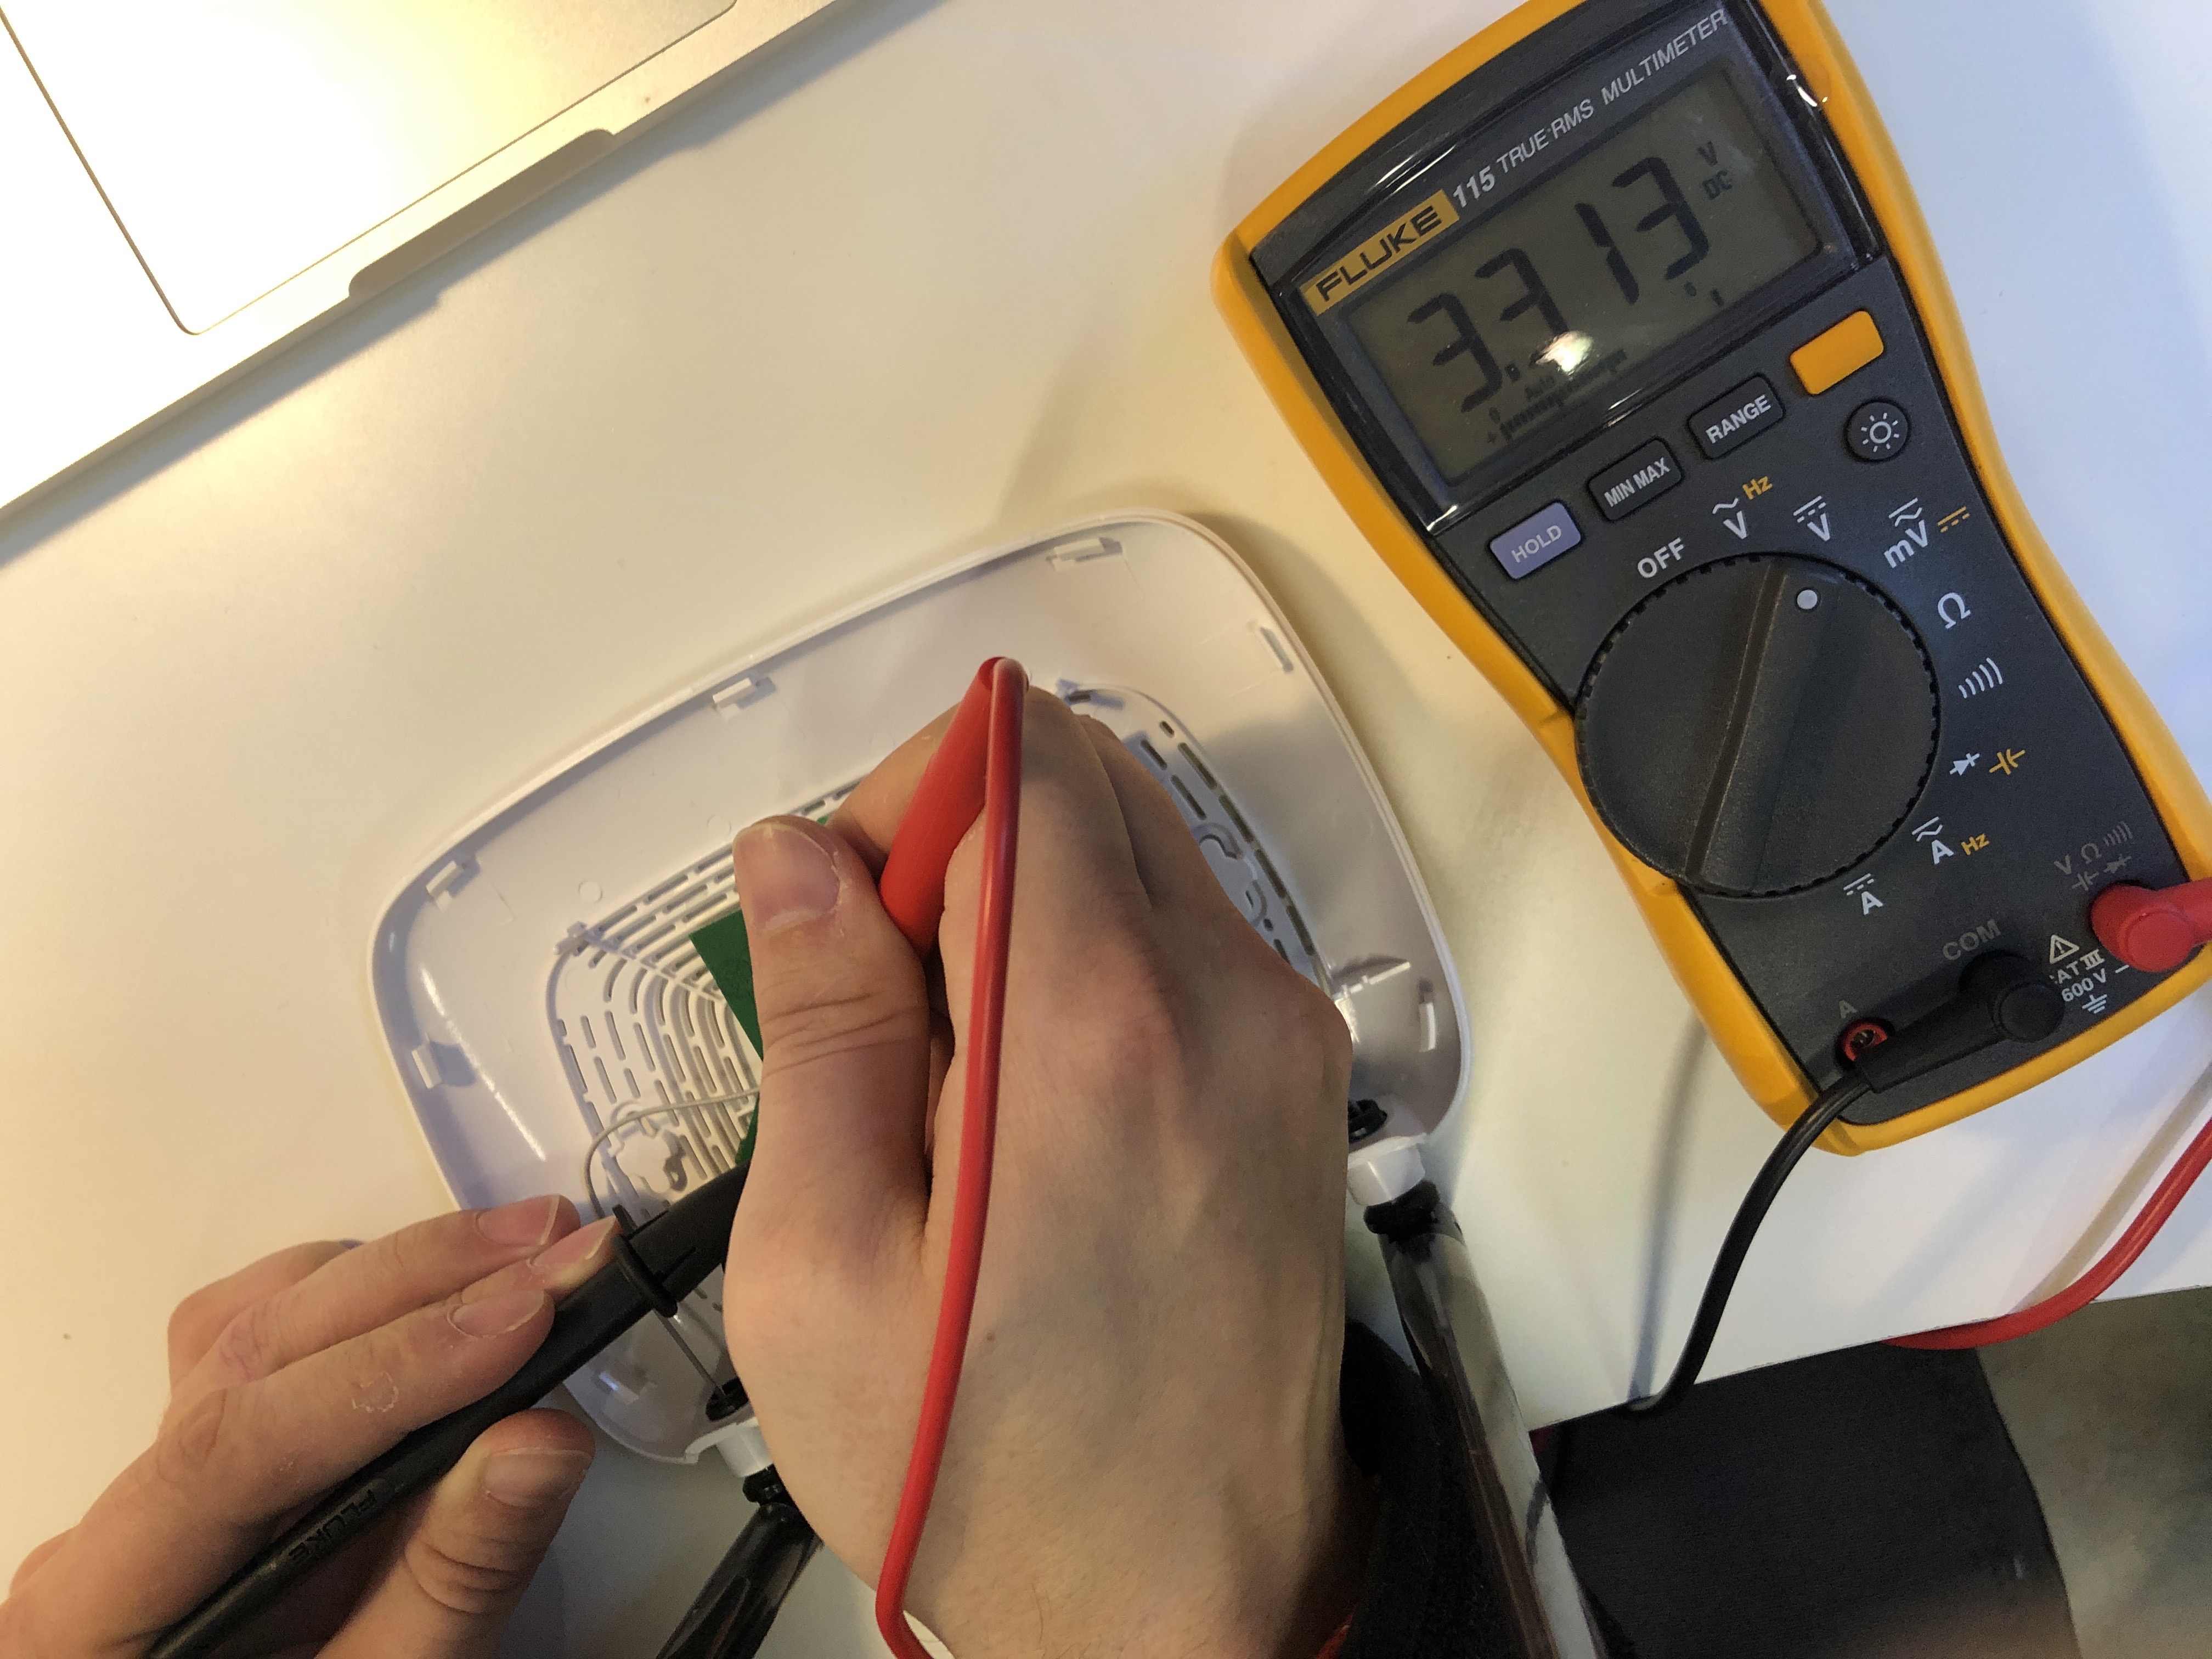
The voltage that the router uses needs to be measured so that we can configure the FTDI to use the same voltage.
Using a multimeter we first test the pins to determine which is the GND (ground). Set the multimeter to continuity testing and touch one probe to the grounded shielding and use the other probe to touch each pin one at a time. When a ground pin is probed the multimeter will beep and indicate that the two have electrical continuity. GND is found on pin 1.
From the logic analyzer we saw that the pin on Channel 0 was high and we now know that pin 1 is GND. We can measure the voltage between the two to determine which voltage level the router uses. With this measurement we are able to determine that we should use the 3.3V configuration.
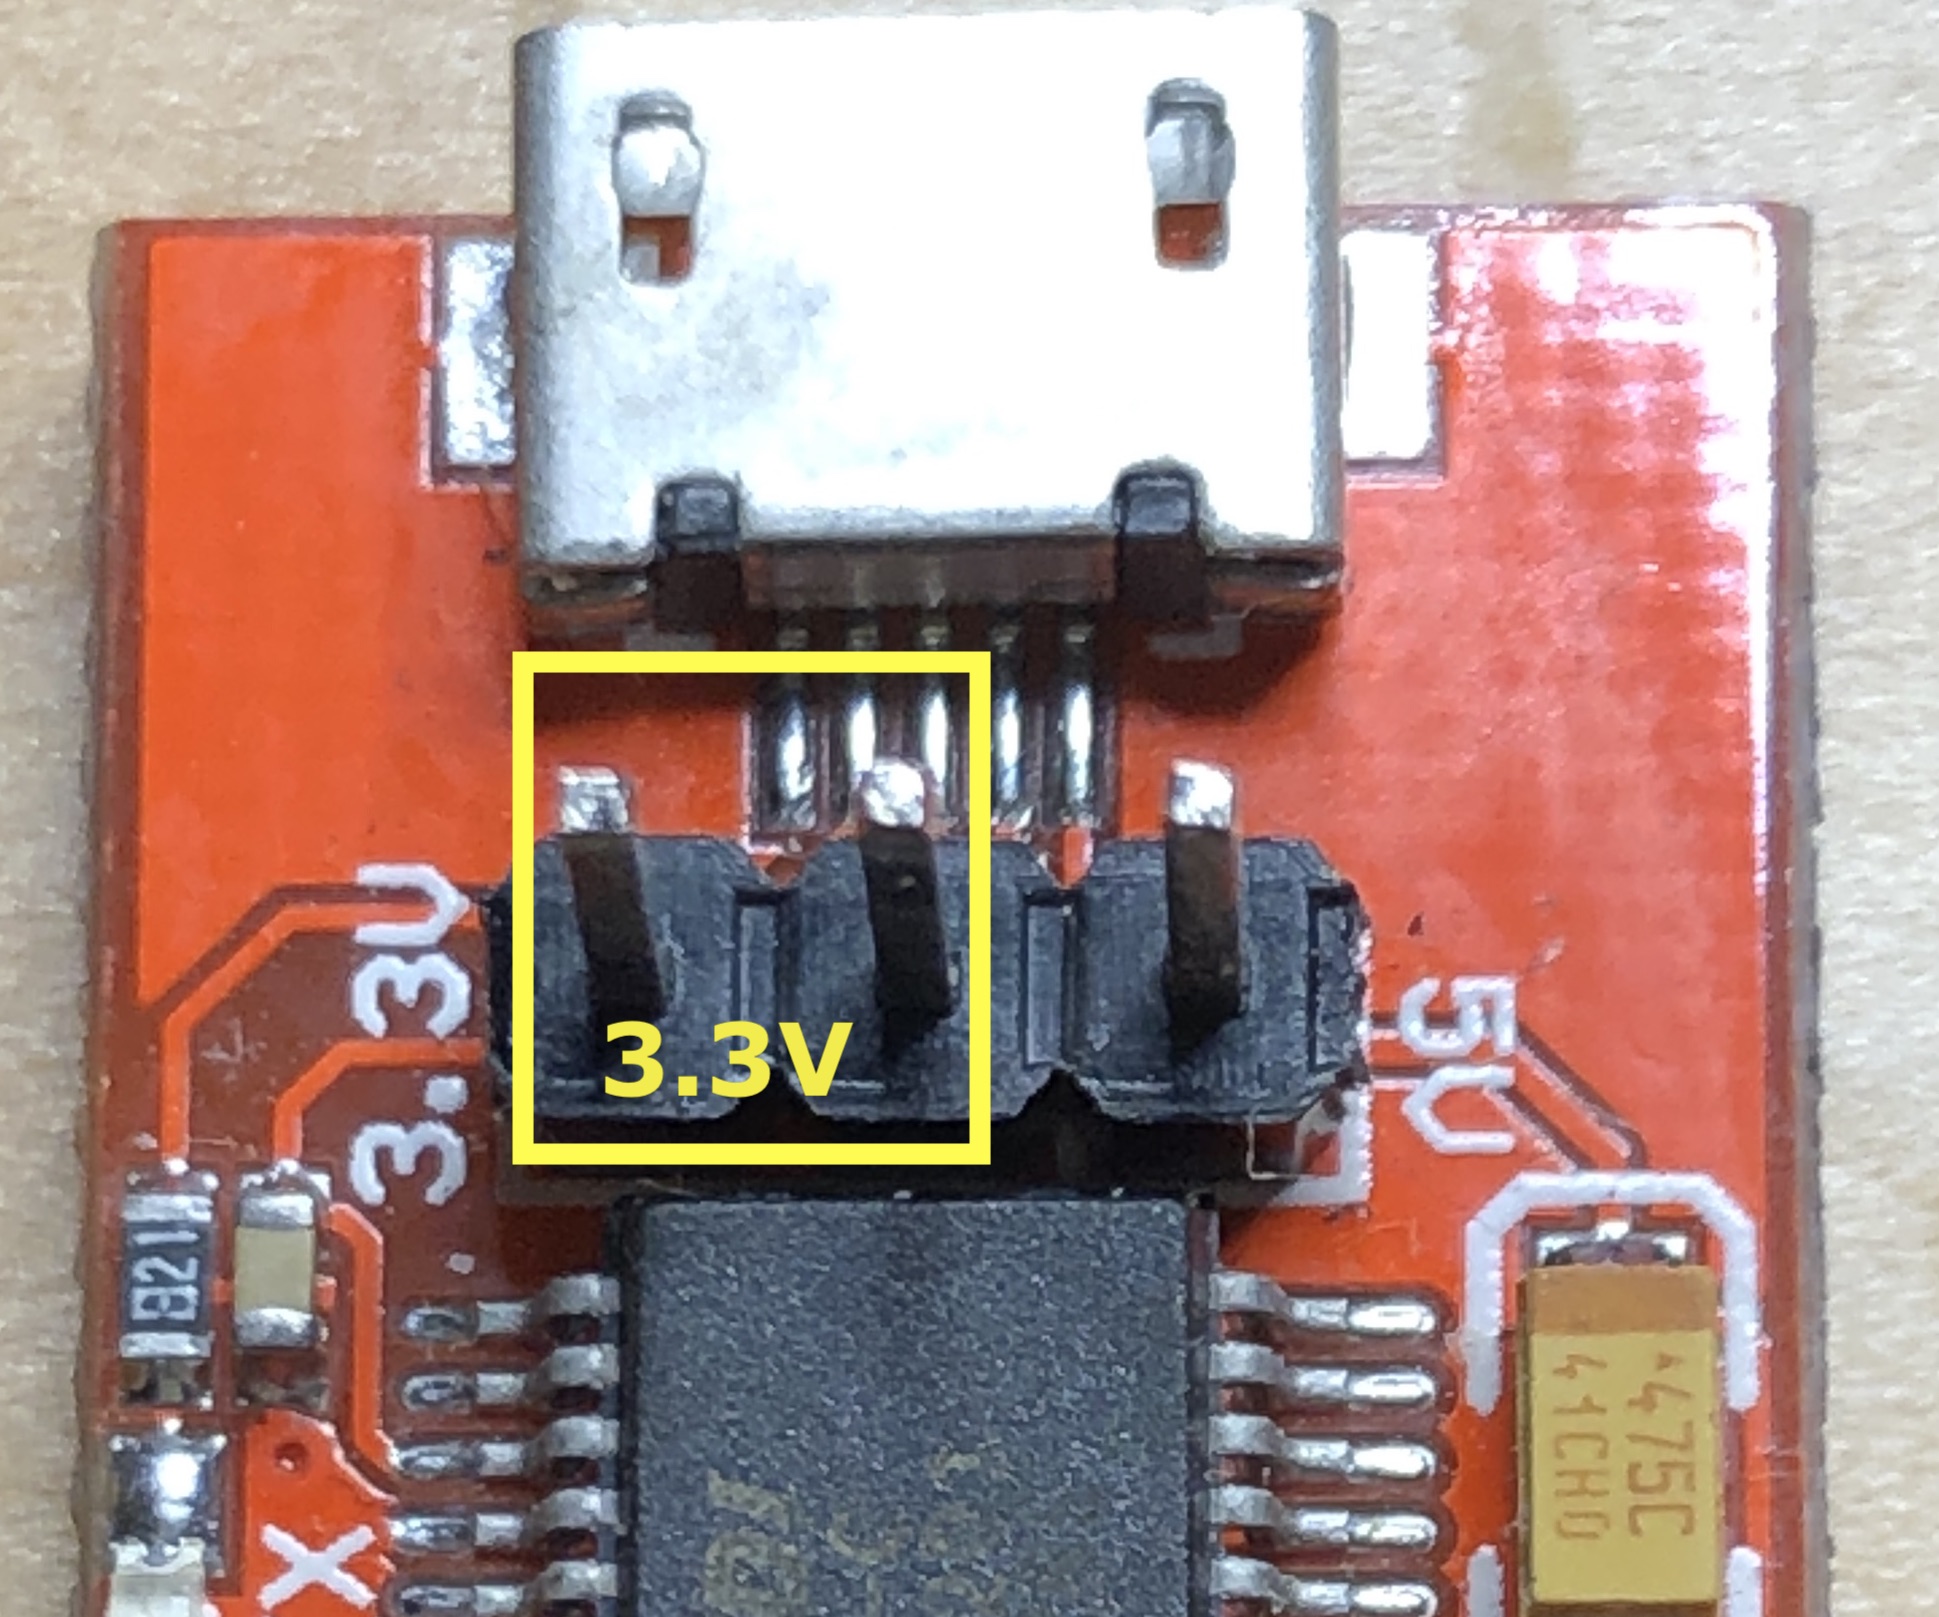
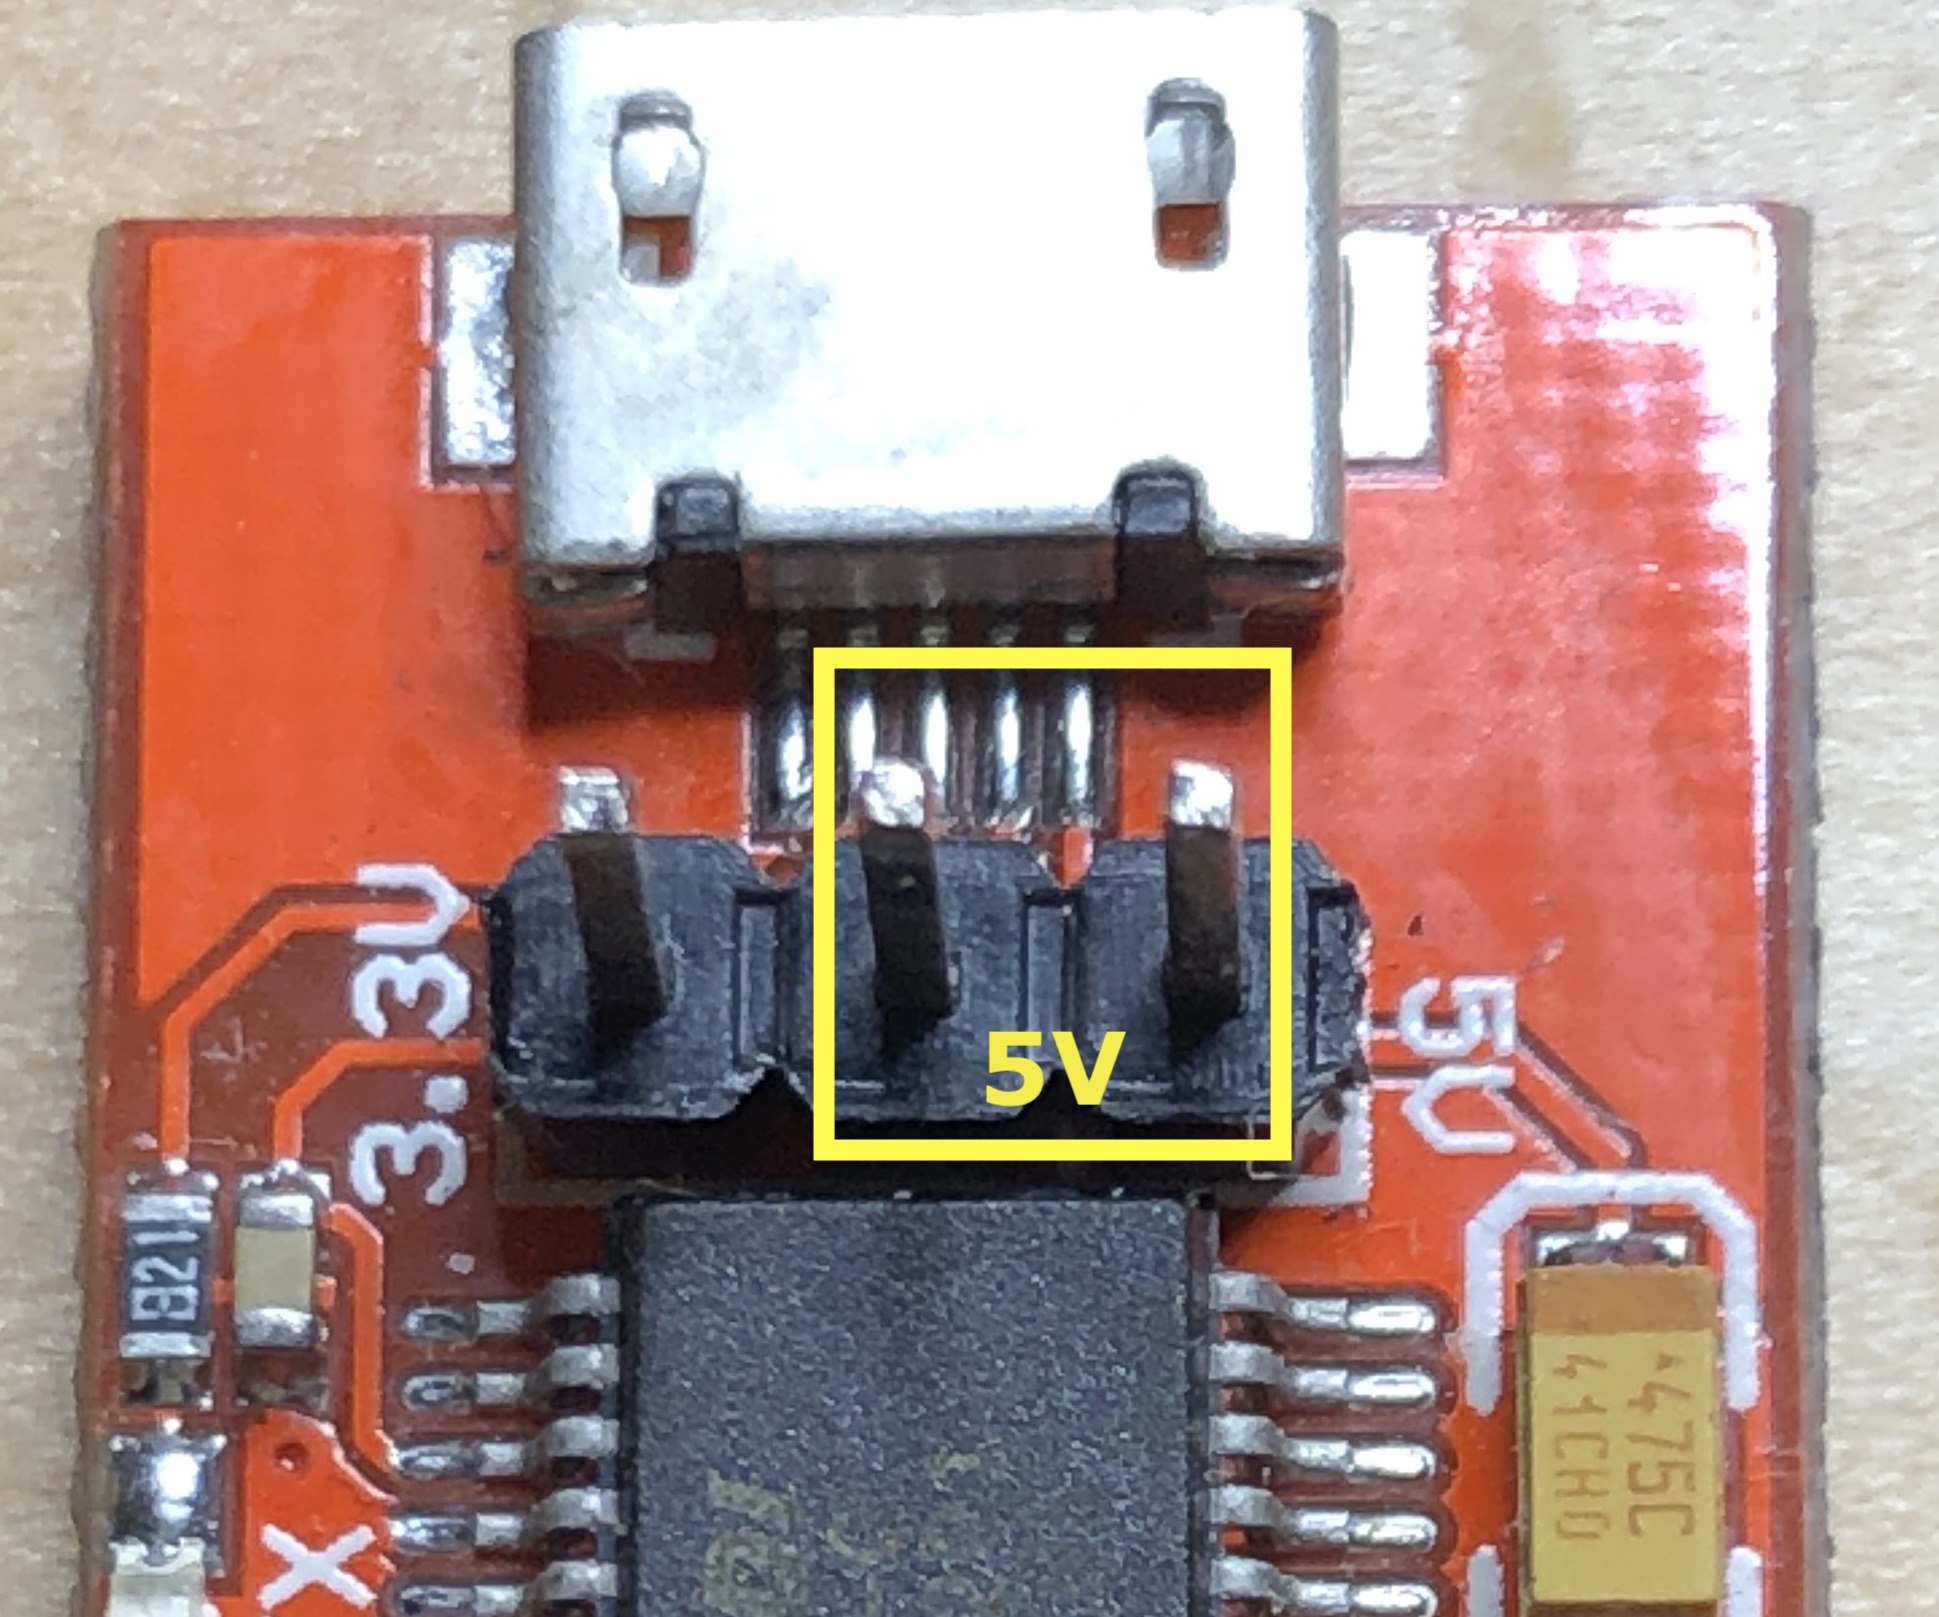
The FTDI board we are using has a removable jumper to bridge two pins. Move the jumper to the appropriate pins that indicate 3.3V. Some FTDI boards will only work on one voltage.
|
|
|
Connecting to Serial and Finding RX
Wire up the FTDI to the UART pins on the router. We will only need to connect the RX, TX, and GND pins; we can skip the VCC pin since the router provides its own power. Remember to connect the RX to TX between two UART devices.
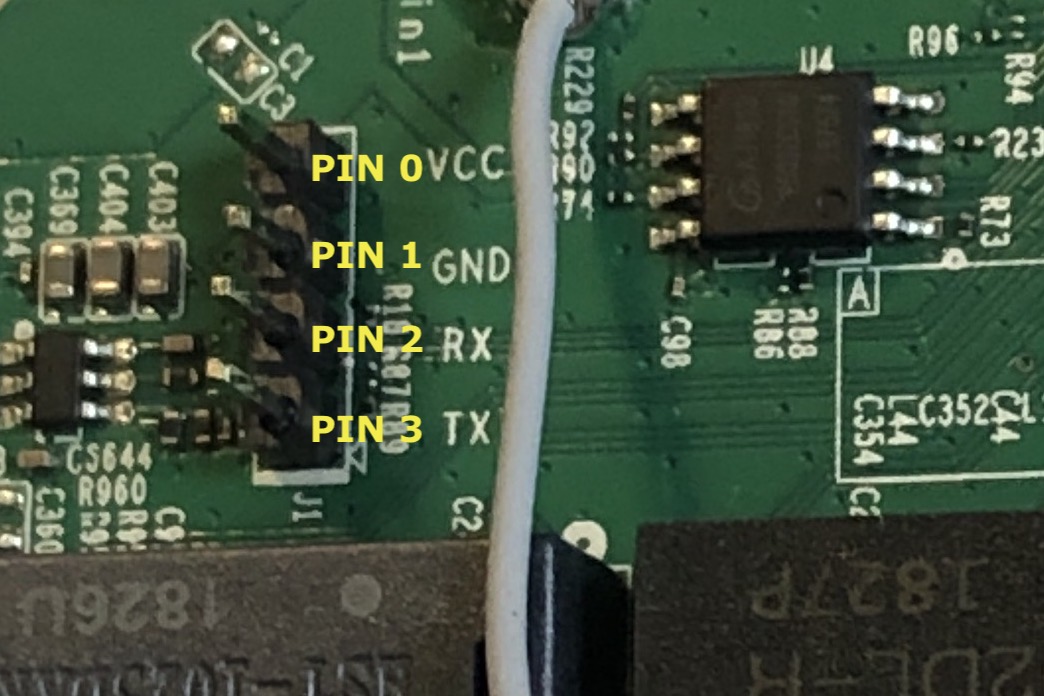
So far we have found VCC, GND, and TX:
- PIN 0: VCC
- PIN 1: GND
- PIN 2:
- PIN 3: TX
By the process of elimination, we can assume that PIN 2 is the RX pin. We will verify this when we connect the router to a serial interface on our computer, since we will see our input echo back.3 Tools like RS232enum (https://github.com/cyphunk/RS232enum) and JTAGulator (http://www.grandideastudio.com/jtagulator/) will do UART pin discovery through a brute force method of iterating through all the pins, sending a message and listening for the message echo back. We can use the same method if there were multiple remaining unknown pins to examine while looking for RX. Typically, the RX and TX pins are adjacent.
Plug the FTDI into your computer and launch your favorite serial communication program.
Some options:
Linux/Mac
- minicom: https://linux.die.net/man/1/minicom
- screen: https://linux.die.net/man/1/screen
Windows
- PuTTY: https://www.putty.org/
In this example we have used screen to connect to the serial console.
$ screen /dev/ttyUSB0 115200
Once the serial terminal is opened we can turn on the router and watch the output as it boots up.
[04060C0D][04060C0D][89890000][22224343][00222242]
DU Setting Cal Done


U-Boot 1.1.3 (Mar 19 2018 - 09:23:08)

Board: Ralink APSoC DRAM:  32 MB
relocate_code Pointer at: 81fc0000
flash manufacture id: c8, device id 40 16
find flash: GD25Q32B
============================================
Ralink UBoot Version: 4.3.0.0
--------------------------------------------
ASIC 7628_MP (Port5<->None)
DRAM component: 256 Mbits DDR, width 16
DRAM bus: 16 bit
Total memory: 32 MBytes
Flash component: SPI Flash
Date:Mar 19 2018  Time:09:23:08
============================================
icache: sets:512, ways:4, linesz:32 ,total:65536
dcache: sets:256, ways:4, linesz:32 ,total:32768

 ##### The CPU freq = 580 MHZ ####
 estimate memory size =32 Mbytes
RESET MT7628 PHY!!!!!!
continue to starting system.
 0
disable switch phyport...

3: System Boot system code via Flash.(0xbc010000)
do_bootm:argc=2, addr=0xbc010000
## Booting image at bc010000 ...
   Uncompressing Kernel Image ... OK
No initrd
## Transferring control to Linux (at address 8000c150) ...
## Giving linux memsize in MB, 32

Starting kernel ...


LINUX started...

 THIS IS ASIC
Linux version 2.6.36 (tomcat@buildserver) (gcc version 4.6.3 (Buildroot 2012.11.1) ) #1 Mon Mar 19 09:25:41 CST 2018

 The CPU feqenuce set to 575 MHz

 MIPS CPU sleep mode enabled.

[CONT.]
We can see lots of information about the device, filesystem, programs running, versions of software, configurations, firewall rules, and much more.
The cherry on top is that we are also provided an unauthenticated root shell to the device on this interface!
~ # echo $USER
root
Conclusion
These are the basics to finding and communicating with an embedded device via UART, and it’s only the tip of the iceberg. There are many more interesting things that we can do once we have a UART interface such as interrupting the boot process to access the bootloader, make use of the boot logs to identify how to trigger scripts to run custom code, and change settings to give us more access. Most modern embedded devices aren’t as simple as the example shown here. Many have protections in place to disable the UART console or have the debug pads removed from the PCB. Although this adds complexity, there are many tricks we use to navigate around the protections in place. Security is difficult, and as we’ve seen in this example, the failure to secure your hardware gives attackers valuable information and access to your device. Be safe out there.
We encourage you to contact us if you have any questions or comments based on this post or have questions about hardware reverse engineering or penetration testing.
-
For the sake of simplicity, we refer to a half-duplex radio here by a colloquial name. ↩︎
-
Although many devices print logging during boot, a growing number of devices remove this output to help limit information available to an attacker or reverse engineer. In these cases, we use other techniques to try to gain output from the device. ↩︎
-
More commonly, devices will disable the console, and therefore, input will not be accepted even on the correct RX pin, and no echo response will be seen. ↩︎